Refer to the graph shown. Which of the curves represents an inverted yield curve?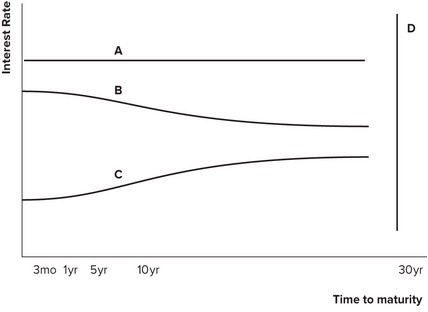
A. A
B. B
C. C
D. D
Answer: B
You might also like to view...
Karl has a home business that consists of only himself and his computer. If he were to analyze his operations in the form of a long run production function his isoquants would
A. be straight lines with a negative slope. B. be concave from above. C. be L shaped. D. be straight lines with a positive slope.
During the 2000-2009 decade,
a. the economic freedom rating of the United States fell, but the growth rate of real GDP was more rapid than in recent decades.
b. the economic freedom rating of the United States increased and the growth of real GDP was more rapid than that of recent decades.
c. the economic freedom rating of the United States fell and the growth of real GDP was less rapid than that of recent decades.
d. the economic freedom rating of the United States increased but the growth of real GDP was less rapid than that of recent decades.
GDP excludes important factors that affect people's well-being, such as the value of:
A. leisure time. B. goods produced domestically but sold to foreigners. C. services purchased by households. D. government purchases of goods and services.
Explain why the ratio of assets to capital increased dramatically for commercial banks from the 1960s to the present.
What will be an ideal response?