Exhibit 4-8 Demand and supply curves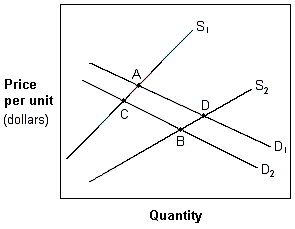
In Exhibit 4-8, a movement from A to C is best described as a(n):
A. increase in the quantity supplied and a decrease in the demand.
B. decrease in the quantity supplied and a decrease in demand.
C. decrease in the quantity supplied and an increase in demand.
D. decrease in the quantity demanded and a decrease in supply.
Answer: B
You might also like to view...
Which of the following statements is TRUE?
A) In the long run, the average cost curve is always downward sloping. B) In the long run, the quantities of all inputs are fixed. C) In the long run, the firms' fixed costs are greater than its variable costs. D) In the long run, all costs are variable costs.
At the beginning of a year, decision makers expect the general level of prices to increase at a 6 percent annual rate. The CPI increases from 150 to 154.5 during the year; this indicates that
a. decision makers underestimated the rate of inflation during the year. b. decision makers overestimated the rate of inflation during the year. c. decision makers accurately forecast the rate of inflation during the year. d. the rate of inflation during the year was 4.5 percent.
An economy's natural rate of unemployment refers to the amount of unemployment that the economy normally experiences
a. True b. False Indicate whether the statement is true or false
Explain how businesses decide how much labor to hire in order to produce a certain level of output
What will be an ideal response?