The table shows, for some particular year, a listing of several income levels and, for each level, the proportion of the population in the level and the probability that a person in that level bought a new car during the year. Given that one of the people who bought a new car during that year is randomly selected, find the probability that that person was in the indicated income category. Round your answer to the nearest hundredth. 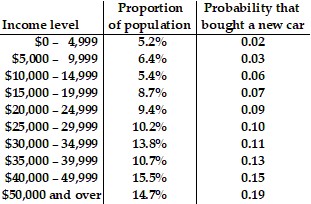 $25,000 - $29,999
A. 0.09
B. 0.07
C. 0.13
D. 0.14
Answer: A
Mathematics
You might also like to view...
Convert the decimal to a percent.7.7
A. 77% B. 0.0077% C. 0.77% D. 770%
Mathematics
Use a calculator to convert from polar to rectangular coordinates. Round to the nearest hundredth.
A. (0.40, 2.27) B. (0.40, -2.27) C. (-2.27, 0.40) D. (2.27, 0.40)
Mathematics
Use a proportion to solve the problem.The 16th hole at the Riverwoods Golf Course is 250 yards long. How long would it be on a model with a scale of 2.5 inches to 50 yards?
A. 6.25 inches B. 62.5 inches C. 125 inches D. 12.5 inches
Mathematics
Verify the given identity.

What will be an ideal response?
Mathematics