Using Figure 1 above, if the aggregate demand curve shifts from AD3 to AD2 the result in the long run would be: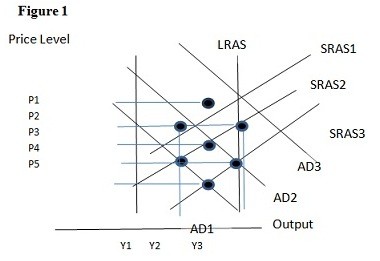
A. P1 and Y2.
B. P2 and Y1.
C. P3 and Y1.
D. P3 and Y2.
Answer: D
You might also like to view...
For a firm in a perfectly competitive market, average revenue equals
A) average cost. B) the change in total revenue. C) the market price. D) price divided by quantity.
The difference between the national debt and a federal budget deficit is
What will be an ideal response?
Suppose Joe has a two-year old Honda Civic that's in excellent condition and that he would be willing to sell for $13,000. Lauren, who is risk-neutral, is considering whether to buy Joe's car. She's willing to pay $14,000 for a two-year Honda Civic that's in excellent condition and only $10,000 for one that's not in excellent condition. Lauren cannot tell whether Joe's car is in excellent condition. She believes that only 20 percent of two-year old Hondas for sale in the market are in excellent condition and that the other 80 percent are not in excellent condition. If Joe offers a warranty in which he makes a legally binding commitment to pay for any major repairs the car needs in the next 18 months, then this ________ serve a credible signal because ________.
A. will; it is more costly for people with low-quality cars to offer such a warranty B. will not; people who sell used cars are rarely honest C. will; people who own cars that are in excellent condition are usually honest D. will not; it is less costly for people with low-quality cars to offer such a warranty
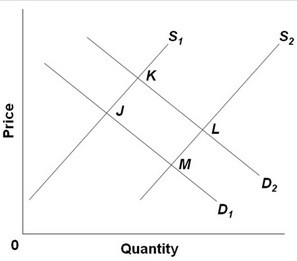 Refer to the above diagram, in which S1 and D1 represent the original supply and demand curves and S2 and D2 the new curves. In this market the indicated shift in supply may have been caused by:
A. this product becoming less fashionable. B. an increase in the wages paid to workers producing this good. C. an increase in consumer incomes. D. the development of more efficient machinery for producing this good.