Sketch the graph of the rational function.f(x) = 

A. 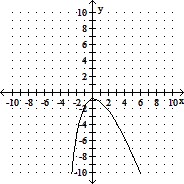
B. 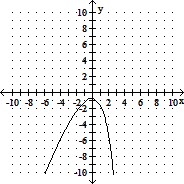
C. 
D. 
Answer: D
You might also like to view...
For the point given in rectangular coordinates, find equivalent polar coordinates  for
for  and
and  Approximate ? to the nearest hundredth of a radian.(-7, 24)
A. (25, 1.29) B. (50, 1.29) C. (25, 1.85) D. (25, 2.86)
Simplify.
A. 
B. 
C. 
D. 
Use the change of base formula and a calculator to evaluate the logarithm. Round your answer to two decimal places.log2/319
A. 8.92 B. 7.26 C. -14.52 D. -7.26
Solve the problem.The average number of vehicles waiting in line at a toll booth of a super highway is modeled by the function  , where x is a quantity between 0 and 1 known as the traffic intensity. What happens to the average number of vehicles waiting as traffic intensity increases?
A. The average number of vehicles waiting decreases at first, but then increases. B. The average number of vehicles waiting remains constant. C. The average number of vehicles waiting increases. D. The average number of vehicles waiting decreases.