Given the nature of this variable, you would use a ______ to illustrate the data for this variable.
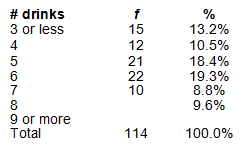
a. pie chart
b. normal distribution
c. bar chart
d. frequency polygon
c. bar chart
You might also like to view...
What is outlined by a philosophy of teaching statement?
What will be an ideal response?
The performance of the target behavior and where along the y-axis the data points fall is called ___________
A. level of behavior B. variability in performance C. statistical analysis D. None of the above
The incidence of child abuse, poor health, underachievement in school, and attendance problems is higher among children who _______
A. are immigrants to the United States B. speak English as a second language C. are homeless D. live in foster homes
Most syllabi will include all of the following EXCEPT:
a. Chairperson contact information b. Course outline c. Learning outcomes d. Professor contact information