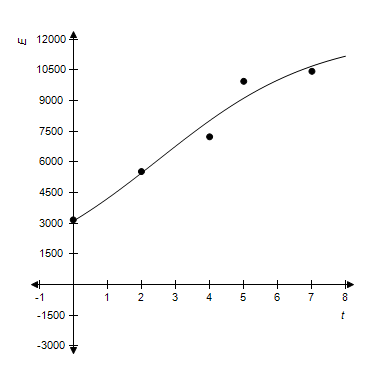
The following data show the number E of elk in a national park t years after 2000.
t 0 2 4 5 7 E 3,170 5,531 7,230 9,941 10,430?
A: Use logistic regression to model E as a function of t.B: Plot the graph of the data along with the model you found in part A.C: According to the model, what is the carrying capacity for elk in this park?D: When did the elk population reach 90.00% of carrying capacity?
?
Round your answers to two decimal places, if necessary.
What will be an ideal response?

?
B:?
?
C: 12,224.00
?
D: 7.61 years after 2000
You might also like to view...
Solve the problem.Assume that a person spins the pointer and is awarded the amount indicated by the pointer. Determine the person's expectation.
A. $7.25 B. $5.25 C. $10.50 D. $7.50
Use the circle graph to solve the problem.The circle graph below gives the number of students in the residence halls at the state university.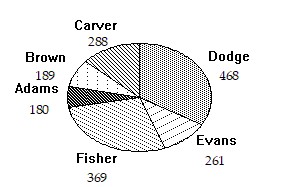 Write the ratio of the number of residents at Adams to the number of students at Carver.
A. 
B. 
C. 
D. 
Solve the problem.The maximum monthly average temperature in Smithville is 89° in July, and the minimum is 37° in January. Determine  so that f
 models the monthly average temperature in Smithville, where x is the month and
  corresponds to January.
A. f = 26 cos
  + 63
+ 63
B. f = 26 cos
  + 63
+ 63
C. f = 63 cos
  + 26
+ 26
D. f = 26 cos
  + 63
+ 63
Differentiate.f(x) = 4 log x
A. 
B. 
C. 
D. 