The figure shows the percentage of the U.S. population, f(x), made up of teachersas a function of time, x, where x is the number of years after 1900. Use the graph to solve the problem.  In which year did the percentage of teachers in the U.S. reach a minimum?
A. 2000
B. 1900
C. 1970
D. 1990
Answer: A
You might also like to view...
Solve the problem.Select an appropriate graph of a twice-differentiable function y = f(x) that passes through the points src="https://sciemce.com/media/4/ppg__tttt0612191139__f1q8g6.jpg" style="vertical-align: -20.0px;" /> ,
,  , (0,0),
  and (
and ( ,1), and whose first two derivatives have the following sign patterns.y' :
 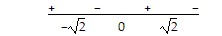 y" :
y" :
A. 
B. 
C. 
D. 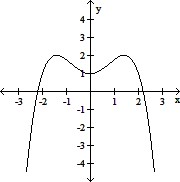
Perform the matrix operation.Given A =  and B =
  , find AB.
A. 
B. 
C.

D. 
Solve the problem. Round your answer to the nearest tenth.A person is pulling a freight cart with a force of 51 pounds. How much work is done in moving the cart 70 feet if the cart's handle makes an angle of 31° with the ground?
A. 3060.1 ft-lb B. 3208.7 ft-lb C. 183.9 ft-lb D. 1838.7 ft-lb
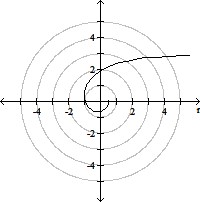
Use a graphing utility to graph the polar equation.r = 

A. 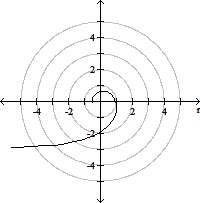
B. 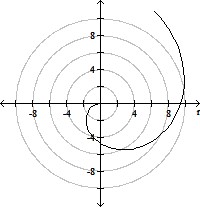
C. 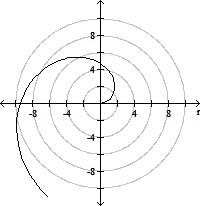
D.