Solve the problem.The following table gives the amount (in millions of tons) of paper and paperboard waste generated in the United States for certain years.Year Waste 196029.9196538.0197044.2197543.0198054.7198561.5199073.3199377.8(a) Use the method of least squares to obtain the straight line that best fits these data. Let x = the number of years after 1960. Round answer to the nearest hundredth(b) If the trend determined by the straight line continues, then when will the amount of paper waste exceed 100 million tons?
What will be an ideal response?
(a) y = 1.41x + 28.45
(b) 2012
You might also like to view...
Solve the problem.Find the center of mass of the hemisphere of constant density bounded 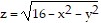 and the
A.  = 0,
= 0,  = 0,
= 0,  =
= 
B.  = 0,
= 0,  = 0,
= 0,  =
= 
C.  = 0,
= 0,  = 0,
= 0,  = 1
= 1
D.  = 0,
= 0,  = 0,
= 0,  =
= 
Evaluate the integral.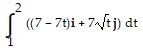
A. -  +
+  (2
(2 - 1)
- 1)
B. -  i +
i +  (2
(2 - 1) j
C.  i +
i +  (2
(2 - 1) j
D. 7 j
j
Solve the problem.A landscaping company sells 30-pound bags of top soil. The actual weight x of a bag, however, may differ from the advertised weight by as much as 0.5 pound. The actual weight of the bag of topsoil, x, can be described by the inequality  Give the solution of the inequality in interval notation.
A. (-?, 29.5] ? [30.5, ?) B. [-29.5, 30.5] C. (29.5, 30.5) D. [29.5, 30.5]
Solve the inequality. < 1
< 1
A. (-?, -7) or (3, ?) B. (-?, -7) C. (-7, ?) D. (-7, 3)