According to the following graphs, the consumer's demand curve for X is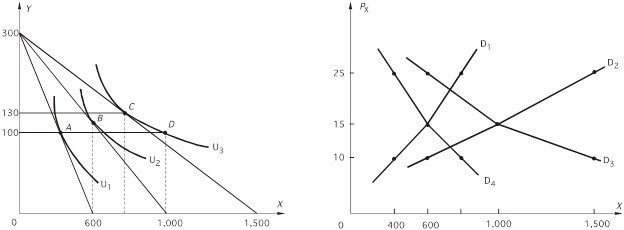 The price of Y is $50.
A. D1.
B. D2.
C. D3.
D. D4.
Answer: D
You might also like to view...
What most accurately describes the U.S. compared to other nations in the early 1900s?
a. The U.S., which was still quite young, was one of the least productive nations in the world in both the agricultural and manufacturing sectors. b. The U.S., Great Britain and Germany were the three most industrialized nations. c. The industrial output in the U.S. was about average compared the rest of the nations in the world. d. The U.S., which had large supplies of land, had a highly productive agricultural sector, but its industrial productivity was quite low relative to that of other nations.
The business cycle is actually a continuous series of different __.
A. short-run macroeconomic equilibriums B. potential GDP values C. full-employment equilibriums D. nominal GPD vales
The period of growth in real GDP between the trough of the business cycle and the next peak is called the:
A. recessionary phase. B. recovery phase. C. contractionary phase. D. cyclical phase.
World trade declined in the 1930s. Which of the following is the best explanation of that decline?
A. The incomes of most nations increased, allowing them to become more self-sufficient. B. Trade restrictions increased, but there was little change in world income. C. World income shrank, but there were few changes in trade restrictions. D. World income shrank, and trade restrictions increased.