Using Figure 1 above, if the aggregate demand curve shifts from AD2 to AD1 the result in the long run would be: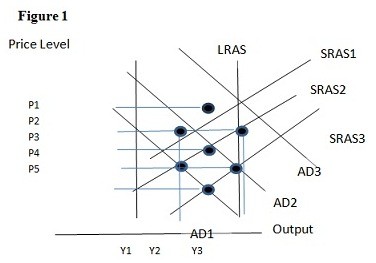
A. P4 and Y1.
B. P4 and Y2.
C. P5 and Y1.
D. P5 and Y2.
Answer: D
You might also like to view...
The above figure shows the cost curves of a profit-maximizing perfectly competitive firm. If the price equals $7,
a) how much will the firm produce? b) how much is the firm's average total, average variable, and marginal costs? c) how much is the firm's total, total variable, and total fixed costs? d) how much is the firm's total revenue and economic profit? e) what will happen in this market in the long run?
Suppose the population of a fictional economy falls into the following categories: 320 are employed full time; 110 are employed part time; 20 are unemployed but are actively looking for employment; 50 are unemployed and are not actively looking for
employment. The official unemployment rate as calculated by the BLS would be A) 4.4%. B) 5.9%. C) 14.0%. D) 28.9%.
Refer to Exhibit 2-9. For Alex, the opportunity cost of producing one unit of good A is ____________ unit(s) of good B.
What will be an ideal response?
A tax levied on purchases of a particular good or service
A. always leads to an increase in total tax revenues. B. always leads to a reduction in total tax revenues. C. is illegal because it is discriminatory. D. is an excise tax.