Create a graphical display for the data given. You may choose any graphic type that you feel is appropriate. Write a few sentences explaining why you chose this type of display and a few sentences describing any interesting patterns in the data.The table below shows statistics for AIDS. The first column shows the estimated number of people living with HIV/AIDS worldwide in various years. The second column shows the estimated number of new HIV infections worldwide in various years. 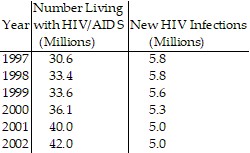
What will be an ideal response?
Answers will vary. One possible answer: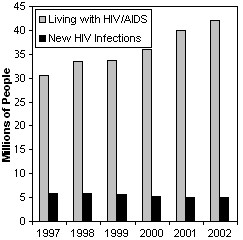
The multiple bar graph shows an increase in people living with HIV/AIDS, but a decrease in new cases of HIV.
You might also like to view...
Find the limit of the sequence if it converges; otherwise indicate divergence.an = 
A. 
B. -11
C. 
D. Diverges
Determine if the sequence is decreasing or nondecreasing and if it is bounded or unbounded from above.an = ln
A. Decreasing; unbounded B. Nondecreasing; bounded C. Nondecreasing; unbounded D. Decreasing; bounded
Solve the problem by using two equations with two variables.A retired couple has $170,000 to invest to obtain annual income. They want some of it invested in safe Certificates of Deposit yielding 7%. The rest they want to invest in AA bonds yielding 12% per year. How much should they invest in each to realize exactly $17,400 per year?
A. $110,000 at 12% and $60,000 at 7% B. $110,000 at 7% and $60,000 at 12% C. $120,000 at 12% and $50,000 at 7% D. $100,000 at 7% and $70,000 at 12%
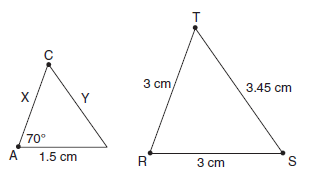
?ABC ~ ?RST. Find the missing lengths and ?R .