The indifference curves in the figure above (I1, I2, and I3 ) reflect Peter's consumption preferences
If Peter consumes 24 slices of pizza and 24 chocolate bars per month, he as satisfied as he would be consuming ________ slices of pizza and ________ chocolate bars per month. A) 48; 12
B) 40; 20
C) 32; 8
D) 16; 16
A
You might also like to view...
In the United States in 2014, the percentage of people who received health insurance through their employer was about
A) 15%. B) 36%. C) 55%. D) 83%.
Both President Bush and President Obama wanted tax cuts to stimulate consumer spending during the 2007-2009 recession
a. True b. False Indicate whether the statement is true or false
Figure 5-2
?
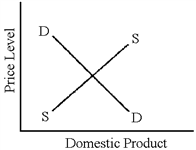 In Figure 5-2, an increase in government spending would cause
A. an outward shift in the aggregate supply curve and an increase in the price level. B. an outward shift in the aggregate demand curve and an increase in the price level. C. an inward shift of the aggregate demand curve and an increase in the price level. D. an inward shift of the aggregate demand curve and a decrease in the price level.
Public goods represent ________ because by their very nature they are nonexcludable and nonrival which makes it difficult for the private sector to supply them profitably.
A. a negative externality B. a positive externality C. efficient production D. a market failure