The graph shown demonstrates a tax on buyers. Who bears the greater tax incidence?
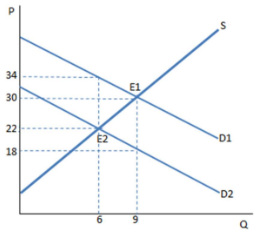
A. The seller
B. The buyer
C. The government
D. The incidence is equally shared between buyer and seller
A. The seller
You might also like to view...
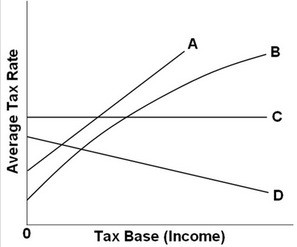 Refer to the above graph. Which of the lines in the above diagram represent(s) a regressive tax?
A. Both A and B B. B only C. C only D. D only
Figure 3-18
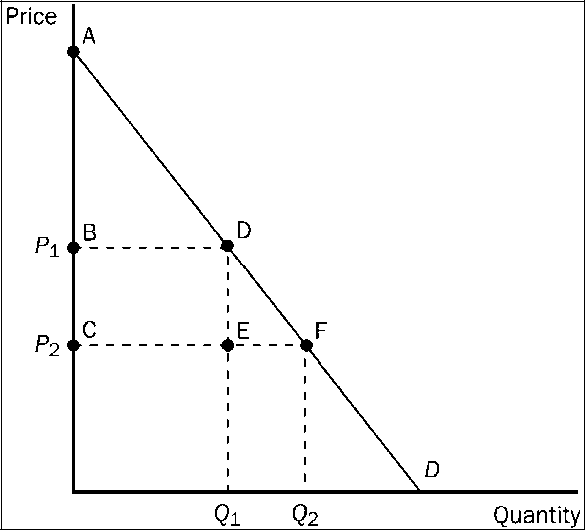
Refer to . Which area represents the increase in consumer surplus when the price falls from P1 to P2?
a.
ABD
b.
ACF
c.
DEF
d.
BCFD
The use of expensive cars and yachts to impress others rather than just as transportation is an example of what economists call:
A. bounded rationality. B. conspicuous consumption. C. rules of thumb. D. focal point equilibrium.
The aggregate demand curve shows how real GDP purchased varies with changes in:
A. unemployment. B. the price of a particular good. C. the overall price level. D. the interest rate.