The figure below shows the production-possibility curves for Canada (AB) and the rest of the world (CD). The opportunity cost of producing a bushel of corn in Canada and in the rest of the world are ________ liters and ________ liters of maple syrup, respectively.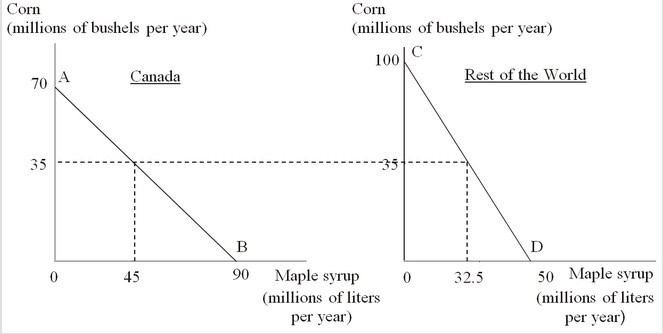
A. 9/7; 1/2
B. 9/7; two
C. 7/9; 1/2
D. 7/9; two
Answer: A
You might also like to view...
Which of the following is correct?
a. Over the last 100 years Japan had a higher average growth rate than the United States. It follows that, today, the standard of living in Japan is higher than in the United States. b. The typical person in Bangladesh today has about twice the real income of a typical American 100 years ago. c. The typical citizen of China today has about one-half as much real income as the typical citizen of America today. d. None of the above is correct.
Fee-for-service insurance
A. requires you pay for services before they are performed. B. allows patients to pick their own doctor. C. is typically less expensive than an HMO covering the same illnesses. D. has more meddlesome bureaucrats than an HMO.
Over 17 million American households had a net worth over $1 million. This means:
A. their total income minus expenses was greater than $1 million. B. the Lorenz curve would show $1 million for over 17 million households. C. their assets minus liabilities were greater than $1 million. D. more than $1 million flowed through the accounts of over 17 million households.
If total revenues rise when the market price increases, then we know that
A) demand is inelastic. B) demand is elastic. C) demand is unit-elastic. D) its demand has zero elasticity.