The graph of a function is given. Use the graph to find the indicated limit and function value, or state that the limit or function value does not exist.a.  f(x)
f(x) b. f(1)
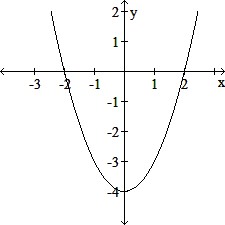
A. a.  f(x) = 1
b. f(1) = 1
B. a.  f(x) = -3
b. f(1) = -3
C. a.  f(x) = 3
b. f(1) = 3
D. a.  f(x) does not exist
b. f(1) = -3
Answer: B
You might also like to view...
Write the number in scientific notation.22,000
A. 2.2 × 10⁻⁵ B. 2.2 × 10⁵ C. 2.2 × 10⁴ D. 2.2 × 10⁻⁴
Solve the problem.A toy company uses the linear model y = -2x + 568 to predict the decline in sales of a toy after it has been on the market more than one year. If x is the number of months after the first year and y is the number of toys sold in hundreds during that month, how many toys will be sold 11 months after the first year?
A. -112,500 toys B. -27,850 toys C. 59,000 toys D. 54,600 toys
Graph the equation as a solid line. Graph the inverse relation as a dashed line on the same axes by reflecting across the line y = x.x = 3

A. 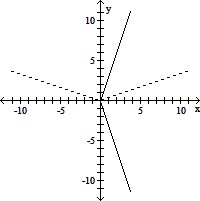
B. 
C. 
D. 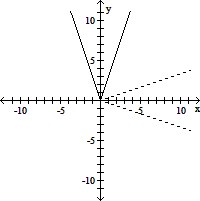
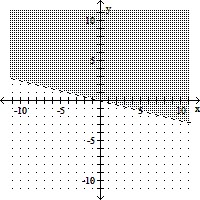
Graph the inequality.y ? -4x
A. 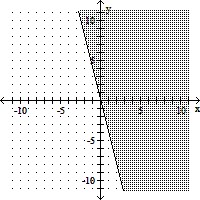
B. 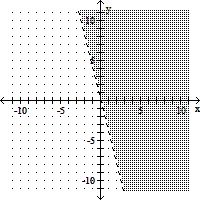
C. 
D.