What is plantation agriculture and where are plantations typically found?
What will be an ideal response?
Answer: A plantation is a form of commercial agriculture in developing regions that specializes in one or two crops. They are found primarily in the tropics and subtropics, especially in Latin America, Sub Saharan Africa, and Asia. Although these plantations are situated in developing countries, they are often owned or operated by Europeans or North Americans. These plantations grow crops for sale primarily in developed countries. Among the most important crops grown on plantations are cotton, sugarcane, coffee, rubber, and tobacco.
Until the U.S. Civil War (1861-1865), plantations were important in the U.S. South, where the principal crop was cotton, followed by tobacco and sugarcane. Slaves brought from Africa performed most of the labor until the abolition of slavery and the defeat of the South in the Civil War. Thereafter, plantations declined in the United States; they were subdivided and either sold to individual farmers or worked by tenant farmers.
You might also like to view...
What are the hottest and the coldest place in Canada and in the world? What factors cause these extreme conditions at these locations?
What will be an ideal response?
How many springs are within 500 meters of existing trails in this part of the National Forest?
Assume you are an avid hiker who is interested in natural springs in the National Forest in the State of Utah. In particular, you want to identify natural springs that are within 500 meters of existing trails in part of the National Forest. In this part of the exercise you will use GIS analysis to solve this problem.
Go to the Hess Physical Geography Laboratory Manual, 12th edition, website at www .MasteringGeography.com and download the “springs.zip” and “trails.zip” datasets. These are partial datasets of the original data downloaded from the Uinta-Wasatch-Cache National Forest website (http://www.fs.usda.gov/detail/uwcnf/landmanagement/gis/?cid=stelprdb5434510). More information about these data—including their metadata—can be found on the website.
Open the datasets by clicking “Add” then “Add Layer from File.” Select the zipped files where you saved them. (Note: do not uncompress, or unzip, the files. ArcGIS Online can read directly from the zipped files.) Do this for both the springs and trails datasets. After adding both layers your map should resemble the one in Figure 8-6, shown in color in the back of the Lab Manual as Map T-32a.
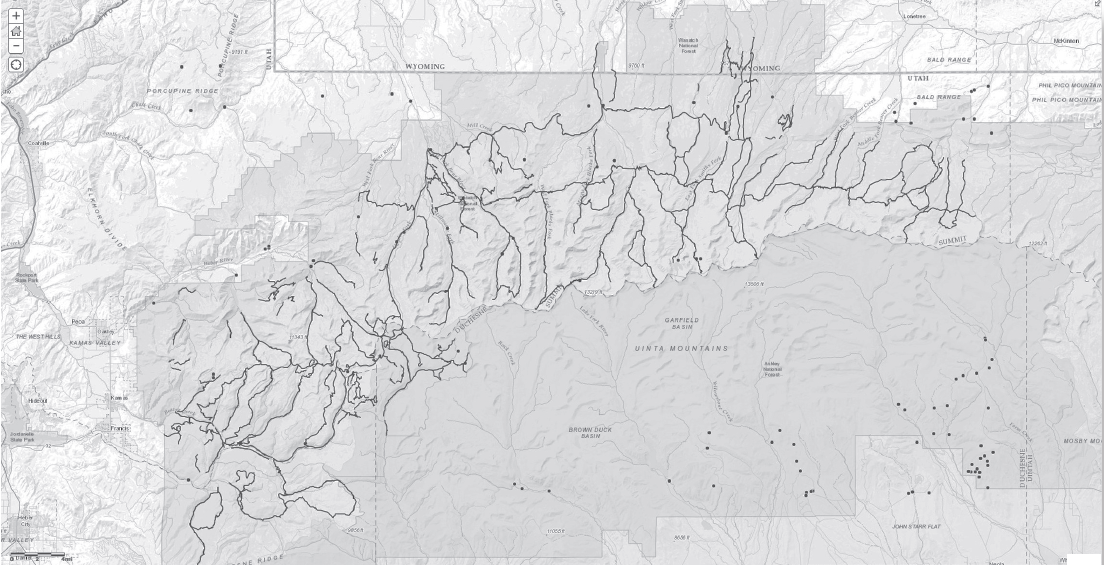
Figure 8-6: Map after adding the springs and trails layers. This map is shown in color as Map T-32a in the back of the Lab Manual.
The next step is to buffer the trails layer to 500 meters. This will create a 500-meter area around each of the trails. Go to “Analysis” then “Use Proximity” and “Create Buffers.” Fill out the parameters as shown in Figure 8-7.
After running this analysis your map should look like that in Figure 8-8 and Map T-32b (in the back of Lab Manual).
You will now overlay the Spring points with the 500-meter buffered trails. To do so, click on “Analysis” then “Manage Data” and “Overlay Layers.” Fill out the parameters as shown in Figure 8-9.
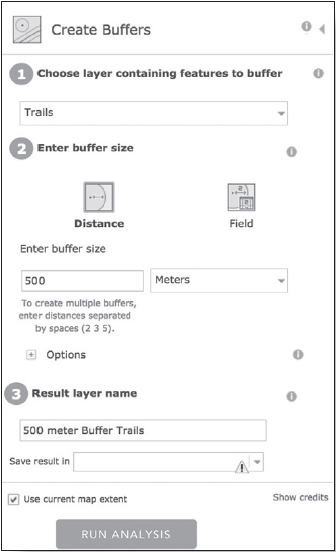
Figure 8-7: Creating buffers in ArcGIS Online.
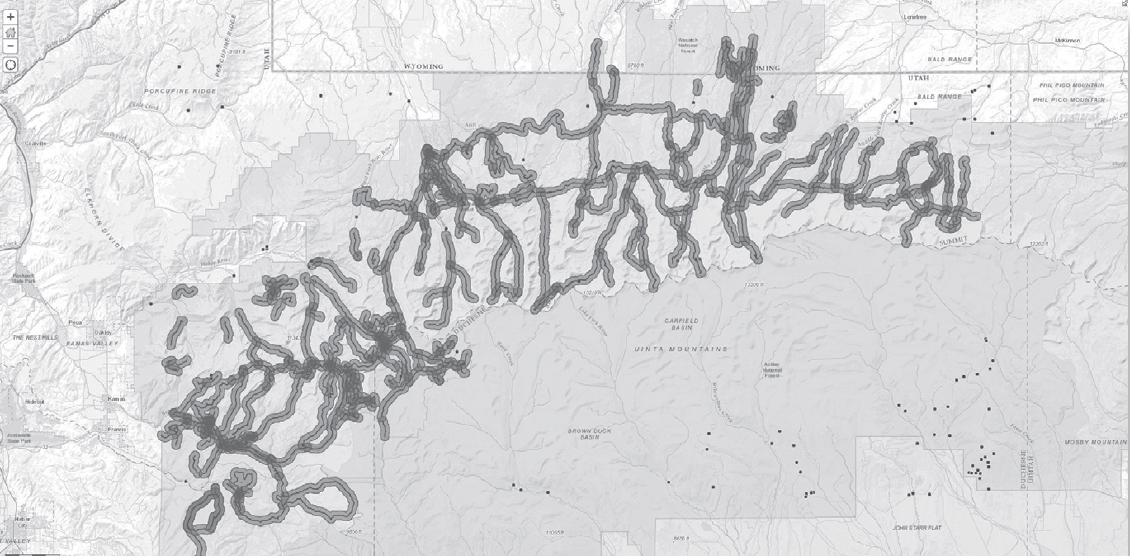
Figure 8-8: Map after running the 500 meter buffer procedure on the trails layer. This map is shown in color as Map T-32b in the back of the Lab Manual.
After completing this step, turn off all layers except for the trails layer and the layer you just created. (You turn off layers by clicking on and removing the check box next to the layers’ names.) Your map should now look like the one in Figure 8-10 (shown in color as Map T-32c), which has the springs within 500 meters of a trail.
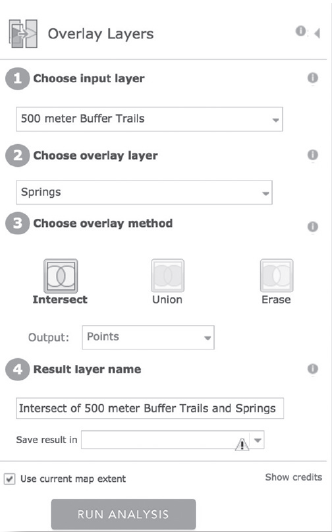
Figure 8-9: Choosing overlay layer in ArcGIS Online.
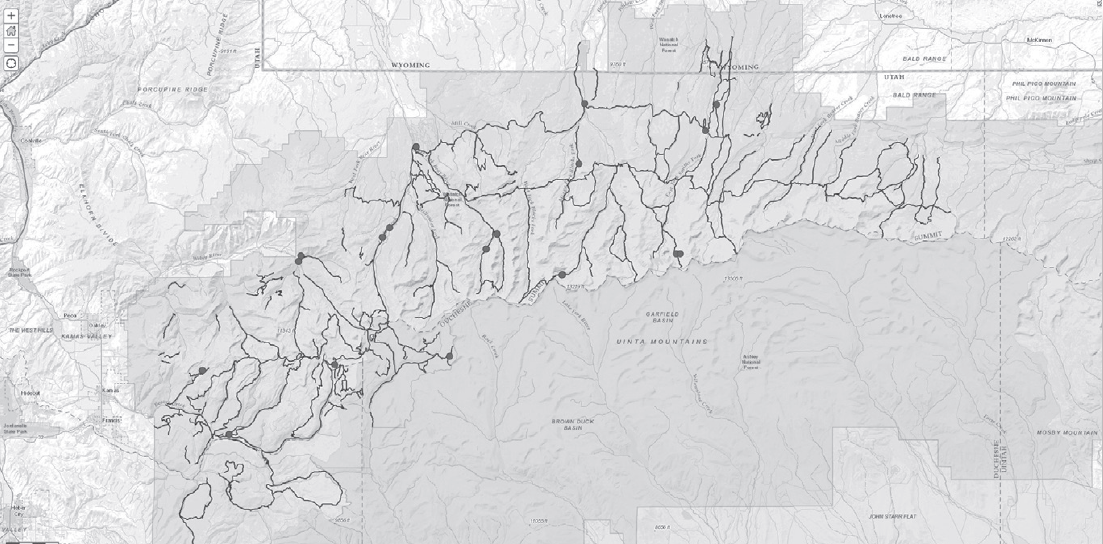
Figure 8-10: Map displaying springs within 500 meters of a trail. This map is shown in color as Map T-32c in the back of the Lab Manual.
Next, determine the number of springs that are within 500 meters of trails. In the Details window click on the name of the newly created layer and click on the table icon . Clicking this icon opens up the layer’s table. Notice at the top of the table the number of points (or records) listed. This number signifies the number of springs within 500 meters of existing trails within this part of the National Forest.
All of the following contribute to high levels of air pollution in countries like China and India EXCEPT
A. they have large cities. B. the pollution from vehicles is poorly regulated. C. the pollution by industry is poorly regulated. D. poor people use wood and dung to cook and heat homes.
The present-day formation of Himalaya Mountains is most like the formation of the _______
Mountains in the Late Paleozoic. a. Appalachian b. Andes c. Cascade