Refer to the graph shown. If the price level is P0 the: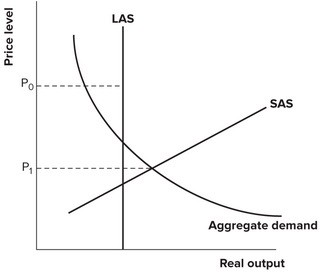
A. aggregate demand curve will shift up in the long run to restore equilibrium.
B. short-run aggregate supply curve will shift up (to the left) in the long run to restore equilibrium.
C. aggregate demand curve will shift down in the long run to restore equilibrium.
D. short-run aggregate supply curve will shift down (to the right) in the long run to restore equilibrium.
Answer: D
You might also like to view...
A demand curve for a normal good
A) slopes upward and to the right. B) is constructed based on the assumption that income is rising. C) is constructed based on the assumption that an inverse relationship exists between price and income. D) shows the inverse relationship between price and quantity demanded.
The area below the demand curve and above the supply curve measures the producer surplus in a market
a. True b. False Indicate whether the statement is true or false
Suppose that 1983 is the base year for the Consumer Price Index (CPI) and in 2014 the CPI was 220. What does this "220" mean?
A) What cost $100 in 1983 on average cost 2.20 times as much in 2014. B) What cost $100 in 1983 on average cost $220 more in 2014. C) What cost $100 in 1983 on average cost 0.22 times as much in 2014 (that is, it cost $22 in 2014). D) What cost $100 in 1983 on average cost $22 more in 2014.
Refer to Scenario 9.9 below to answer the question(s) that follow. SCENARIO 9.9: Sponsors invest $250,000 in a new greeting card business on the promise that they will earn a return of 10% per year on their investment. The business sells 52,000 greeting cards per year. The fixed costs for the business include the return to investors and $79,000 in other fixed costs. Variable costs consist of wages ($1,000 per week) plus materials, electricity, etc. ($3,000 per week). The business is open 52 weeks per year.Refer to Scenario 9.9. The annual fixed costs for the business sum to
A. $25,000. B. $79,000. C. $104,000. D. $208,000.