Graph the quadratic function.
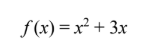
a. 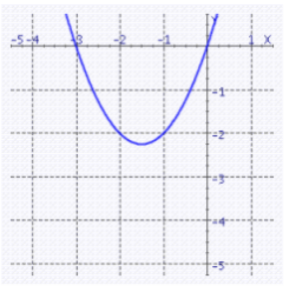
b. 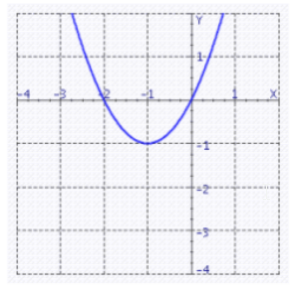
c. 
d. 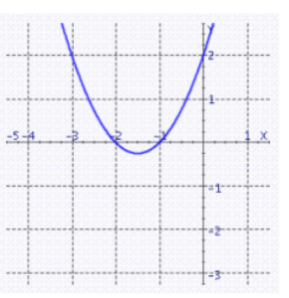
a.
You might also like to view...
Find the indicated decile or percentile.The test scores of 19 students are listed below. Find the sixth decile, D6 .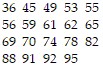
A. 65 B. 74 C. 69 D. 70
Solve the problem.Find the inflection points (if any) on the graph of the function and the coordinates of the points on the graph where the function has a local maximum or local minimum value. Then graph the function in a region large enough to show all these points simultaneously. Add to your picture the graphs of the function's first and second derivatives.y = x3 - 15x2
What will be an ideal response?
Use the circle graph to solve the problem.There are 16,000 students attending the local university. The circle graph shows the percentage of those students who attend different sporting events. How many students attend Basketball and Baseball games?
A. 6080 students B. 832,000 students C. 8320 students D. 2240 students
Explain how to obtain the graph of the given quadratic function from the graph of  f(x) = (x + 5)2
A. Take the graph of y = x2 and shift it 5 units down. B. Take the graph of y = x2 and shift it 5 units to the right. C. Take the graph of y = x2 and shift it 5 units up. D. Take the graph of y = x2 and shift it 5 units to the left.