Plot the indicated graphs.The intensity level B (in dB) and the frequency f (in Hz) for a sound of constant loudness were measured as follows: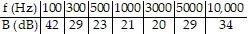 Plot the data for B as a function of f on semilog graph paper, using the logarithmic scale for f.
What will be an ideal response?
Answers will vary.
Mathematics
You might also like to view...
Solve the problem.A poker hand consists of 5 cards dealt from an ordinary deck of 52 playing cards. How many different hands are there consisting of four cards of one suit and one card of another suit?
A. 715 B. 111,540 C. 9295 D. 37,180
Mathematics
Refer to the figure and provide an appropriate name for the indicated angles. 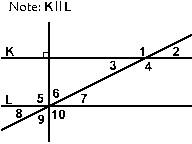 ?4
?4
A. Acute angle B. Vertical angle C. Obtuse angle D. Right angle
Mathematics
Find functions f and g so that f ? g = H.H(x) = 
A.
f(x) =  ; ; | g(x) = 8 |
B.
f(x) =  ; ; | g(x) = 9x + 5 |
C.
f(x) =  ; ; | g(x) = 9x + 5 |
D.
| f(x) = 8; | g(x) =  |
Mathematics
Solve.Find the simple interest when: Principal = $612, Rate = 19%, Time = 6 months.
A. $6,976.80 B. $116.28 C. $697.68 D. $58.14
Mathematics