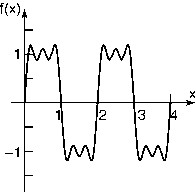
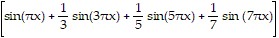
Solve the problem.A square wave is built up from sinusoidal curves of varying periods and amplitudes. Graph the following function, which can be used to approximate the square wave.f(x) = 
 0 ? x ? 4
  A better approximation to the square wave is given by f(x) =
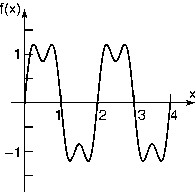
src="https://sciemce.com/media/4/ppg__ttttt0527191203__f1q16g5.jpg" alt="" style="vertical-align: -17.0px;" />0 ? x ? 4  Graph this function and compare the result to the previous graph. Adding another term will improve the approximation even more. Write this new function with four terms.
What will be an ideal response?
 ?
?
f(x) = 
Mathematics
src="https://sciemce.com/media/4/ppg__ttttt0527191203__f1q16g5.jpg" alt="" style="vertical-align: -17.0px;" />0 ? x ? 4 Graph this function and compare the result to the previous graph. Adding another term will improve the approximation even more. Write this new function with four terms.
What will be an ideal response?
| ? | |
You might also like to view...
Use the graph to evaluate the limit. f(x)
f(x)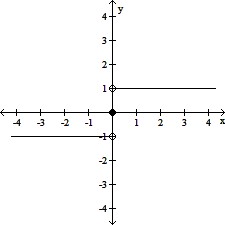
A. does not exist B. -1 C. 1 D. ?
Find the domain of the function.f(x) = 2x + 3
A. (0, ?) B. (-3, ?) C. (-?, 0) ? (0, ?) D. (-?, ?)
Factor completely.2y2 - 8y - 90
A. (y + 5)(2y - 18) B. (2y + 10)(y - 9) C. 2(y2 - 4y - 45) D. 2(y + 5)(y - 9)
Solve the problem.If the average person in Country X consumes 360 lb of poultry annually, express the total annual poultry consumption of Country X, P, as a function of the size of the population, n.
A. P = 360n B. P = n - 360 C. P = 360 D. n = 360P