List the intercepts of the graph.Tell whether the graph is symmetric with respect to the x-axis, y-axis, origin, or none of these. 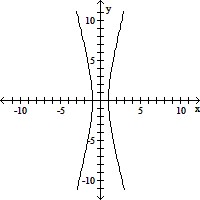
A. intercepts: (0, -1) and (0, 1)
symmetric with respect to x-axis, y-axis, and origin
B. intercepts: (0, -1) and (0, 1)
symmetric with respect to y-axis
C. intercepts: (-1, 0) and (1, 0)
symmetric with respect to origin
D. intercepts: (-1, 0) and (1, 0)
symmetric with respect to x-axis, y-axis, and origin
Answer: D
You might also like to view...
Find the limit. tan x
tan x
A. 1 B. -? C. 0 D. ?
Solve the problem.The graph below shows the decrease in the percentage of Canadians below the poverty level from 1992 to 1997. 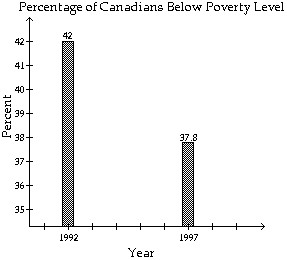 Assume that the rate of decrease continues for the next several years and can be modeled by a linear equation of the form
  Based on such a model, predict the percentage of Canadians below the poverty level in 2010.
A. 26.9% B. 29.0% C. 24.0% D. 56.3%
Write an algebraic expression to answer the question and simplify.What is the sum of 4 consecutive integers if the first integer is x?
A. 4x + x; 5x B. x + x + x + x; 4x C. x + (x + 1) + (x + 2) + (x + 3); 4x + 6 D. Cannot be solved
Solve the problem.Five men recorded their average time to run a mile. The results are shown in the bar graph below. Times are in minutes. How much faster is Randy's average time than Graham's? 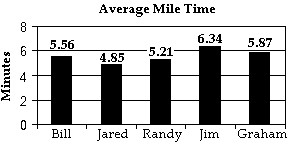
A. 1.13 min B. 0.36 min C. 0.66 min D. 0.56 min