The table shows, for some particular year, a listing of several income levels and, for each level, the proportion of the population in the level and the probability that a person in that level bought a new car during the year. Given that one of the people who bought a new car during that year is randomly selected, find the probability that that person was in the indicated income category. Round your answer to the nearest hundredth. 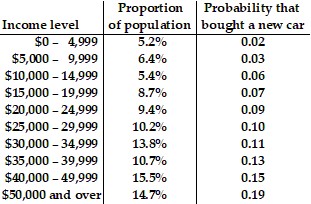 $0 - $4,999
A. 0.03
B. 0.01
C. 0.02
D. 0.05
Answer: B
You might also like to view...
Solve the initial value problem. =
=  + x, x > 0; y(3) = 2
A. y = -  +
+  -
- 
B. y =  +
+  -
- 
C. y =  +
+ 
D. y = -  +
+ 
Solve the problem.Last week, Samantha ran 11 miles. This week, she ran 9 miles. How much more did she run last week?
A. 1 miles
miles
B. 20 miles
miles
C. 12 miles
miles
D. 1 miles
miles
The graph of a function f is given. Use the graph to answer the question.Find the values of x, if any, at which f has a relative minimum. What are the relative minima?
A. f has no relative minimum B. f has a relative minimum at x = -2; the relative minimum is 0 C. f has a relative minimum at x = 0; the relative minimum is 2 D. f has a relative minimum at x = -2 and 2; the relative minimum is 0
Simplify.(-3a6)3
A. -9a6 B. (-3)18a6 C. (-3)18a18 D. (-3)3a18