Find the average rate of change illustrated in the graph. 
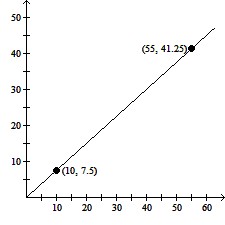
A. 1 mm per second
B. 1.3 mm per second
C. 0.85 mm per second
D. 0.75 mm per second
Answer: D
You might also like to view...
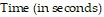
Solve the problem.After introducing an inhibitor into a culture of luminescent bacteria, a scientist monitors the luminosity produced by the culture. Use a graphing utility to fit a logarithmic function to the data. Predict the luminosity after 20 hours.
A. y = 107.55 - 41 ln (x), -15.27 B. y = 112.97 - 45.97 ln (x), -24.74 C. y = 100.5 - 32.7 ln (x), 2.54 D. y = 98.75 - 32.66 ln (x), 0.91
Provide an appropriate response.For the function  with domain of
  find the range.
A. (-?, -1] B. (-?, 1] C. [-7, -1] D. [-1, ?)
Graph the feasible region for the system of inequalities.2y + x ? -2y + 3x ? 9y ? 0x ? 0
A. 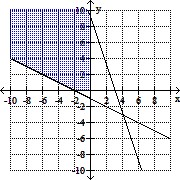
B. 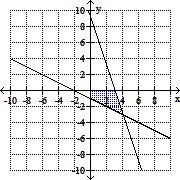
C. 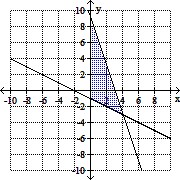
D. 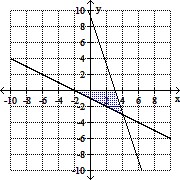
Find the domain of the function.f(x) = log10 
A. (4, ?) B. (-?, -5) C. (-5, 4) D. (-?, -5) ? (4, ?)