Using Figure 1 below, if the aggregate demand curve shifts from AD1 to AD2 the result in the short run would be:
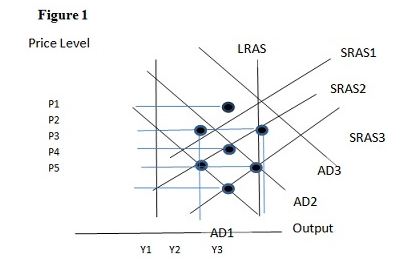
A. P1 and Y2.
B. P3 and Y1.
C. P2 and Y3.
D. P2 and Y2.
C. P2 and Y3.
You might also like to view...
Suppose there is an increase in the price of oranges. Which of the following is a possible cause?
a. increase in income b. increase in the price of sugar, a complement of oranges c. decrease in the price of tangerines, a substitute for oranges d. freeze in Florida e. favorable weather pattern
Which statement is true?
A. Almost one-half of the world's population lives in less developed countries. B. The economies of most of the NICs are growing very slowly. C. The output of the United States today is smaller than it was in 1990. D. The U.S. education system is second to none.
The Laffer curve reflects the view that when
A. tax rates are too low, raising them creates a greater incentive for suppliers to increase production. B. tax rates are too high, lowering them not only creates greater incentive for suppliers to increase production, but also ends up generating higher tax revenues. C. tax revenue is too low, the only way to increase it is through higher tax rates. D. tax rates are too high, lowering them also reduces tax revenue.
Which of the following is a flow variable?
A) income B) money C) financial wealth D) all of the above E) none of the above