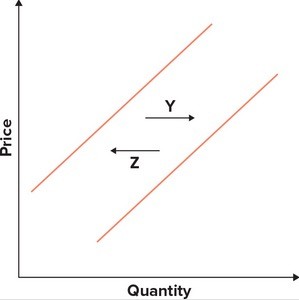
Refer to the graphs shown. The arrow that best captures the impact of a decline in price on quantity supplied is: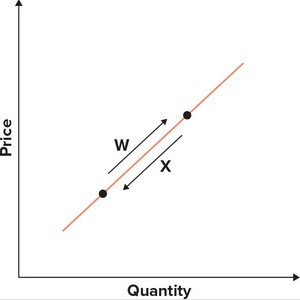
A. W.
B. X.
C. Y.
D. Z.
Answer: B
You might also like to view...
Industry X, which is perfectly competitive, is in long-run equilibrium. Assume a new law is passed that requires employers in industry X to provide health insurance to previously uninsured employees
As a result of this new requirement we would expect to observe: A) a decrease in price and an increase in total output in industry X. B) a decrease in price and total output in industry X. C) an increase in price and a decrease in total output in industry X. D) an increase in price and total output in industry X.
Refer to the table below. What is Gorgeous Sands Resort's long-run average cost?
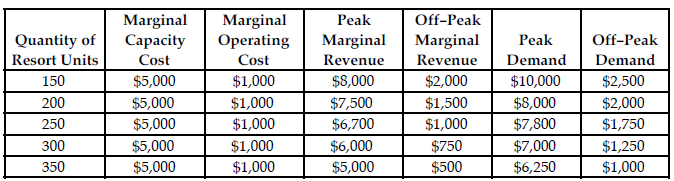
The table above summarizes Gorgeous Sands Resort's marginal capacity cost, marginal operating cost, peak marginal revenue, off-peak marginal revenue, and its peak and off-peak demand for its resort units.
A) $6,000
B) $1,000
C) $3,000
D) $5,000
According to the graph shown, if this economy were to open to trade, surplus would do all of the following except:
This graph demonstrates the domestic demand and supply for a good, as well as the world price for that good.
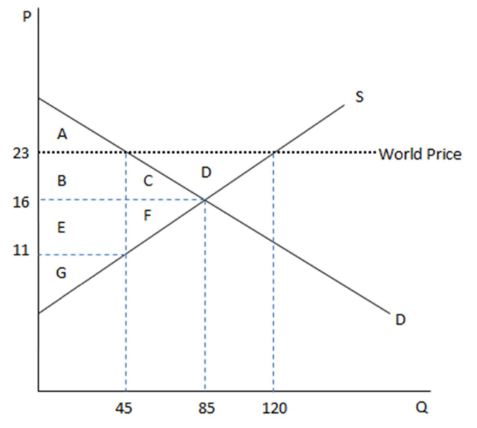
A. increase overall.
B. decrease for the producer.
C. transfer from producer to consumer.
D. create deadweight loss of CEFG.
The windfall profits tax on oil will curtail oil production if
a. oil executives decide to be spiteful. b. the demand for oil is inelastic. c. the supply curve for oil is upward sloping. d. the supply curve for oil is vertical.