The figure above shows two Lorenz curves, one before income redistribution and one after income redistribution. Lorenz curve B represents
A) market income.
B) money income.
C) money income before taxes.
D) income after taxes.
A
You might also like to view...
Refer to above Table 2-1. What is the level of Corporate Profits?
A) 260 B) 180 C) 270 D) 170
All of the following would shift the LRAS curve to the right EXCEPT
A) an increase in the size of the labor force. B) a net inflow of human capital. C) an increase in the overall price level. D) an improvement in technology.
If the price elasticity of demand is 0.6, then a 10 percent increase in the price of the good will lead to a ________ in the quantity demanded.
A. 0.6 percent decrease B. 6 percent decrease C. 6 percent increase D. 0.6 percent increase
Refer to the information provided in Figure 30.1 below to answer the question(s) that follow.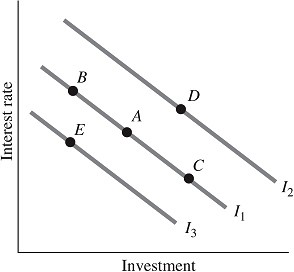 Figure 30.1Refer to Figure 30.1. If the economy is currently at Point C, pessimism about future growth in aggregate output moves the economy to Point
A. E. B. B. C. C. D. D.