Solve the problem.Which one of the following is true according to the graph? 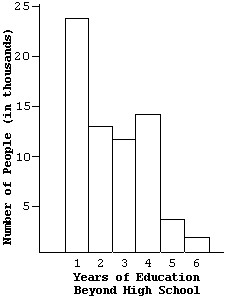
A. The percent of people with years of higher education greater than those shown by any rectangular bar is equal to the percent of people with years of education less than those shown by that bar.
B. If the sample is truly representative, then for a group of 50 people, we can expect about 32 of them to have one year of education beyond high school.
C. The graph is based on a sample of approximately 62 thousand people.
D. More people had 4 years of education beyond high school than 3 years.
Answer: D
You might also like to view...
Perform the indicated operation. Simplify, if possible. +
+ 
A. 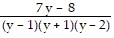
B. 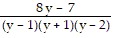
C. 
D. 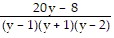
Perform the indicated operation.R(x) = 4x5 - 12x4 - 14, S(x) = 7x4 + 8x5 + 3, T(x) = x6 - 5; Find (R - S + T)(x).
A. x6 - 4x5 - 4x4 - 16 B. x6 - 4x5 - 19x4 - 22 C. x6 - 4x5 - 19x4 - 16 D. -45x9
Provide an appropriate response.
Find cos A to the nearest ten-thousandth if a = 14.5, b = 7.8, and c = 16.5.
A. 2.1154 B. 1.1379 C. 0.4727 D. 0.8788
Use the graph of the function to estimate the x-intercepts.f(x) = 4x2 - 20x + 21
A. x = 1.5, x = 3.5 B. x = -29, x = 21 C. x = 6, x = 14 D. x = -3.5, x = -1.5