Explain the benefit of using a scatterplot.
What will be an ideal response?
Scatterplots are a graphic way of visualizing the relationship between two variables. Each data point on a scatterplot represents two values, an X value and a Y value. X represents the independent variable and Y represents the dependent variable.
You might also like to view...
Upon the deaths of their retired spouses, most widows experience a one-third drop in household income from Social Security
Indicate whether the statement is true or false.
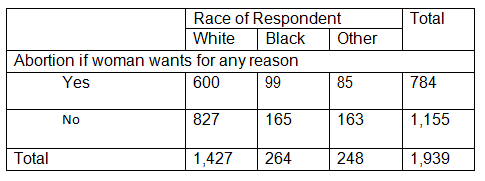
What percentage of respondents who agree are White?
Abortion Attitudes by Race of Respondent Cross-tabulation
A. 40.4
B. 42
C. 65.7
D. 76.5
Milieu therapy would most likely be used in
A. residential treatment. B. family treatment. C. individual casework treatment. D. an adolescent group focusing on truancy.
Systematic desensitization was developed by:
a) Turner b) Ellis c) Beck d) Wolpe