Solve.The student population of a small school has been increasing as shown in the following table.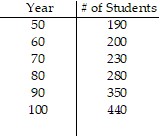 Determine the linear, quadratic, or cubic function that best fits the data.
A. f(x) = 5x - 93.33
B. f(x) = x3 - 0.1x2 - 10x + 440
C. f(x) = 0.002x3 - 0.44x2 + 28.19x - 427.30
D. f(x) = 0.1x2 - 10x + 440
Answer: D
Mathematics
You might also like to view...
Use Euler's method with the specified step size to approximate the solution.Use Euler's method with h = 0.5 to estimate y(2.5) if y' =  and y(0) = 5. Round your answer to four decimal places.
A. y(2.5) ? 89.5263 B. y(2.5) ? 115.8961 C. y(2.5) ? 60.6623 D. y(2.5) ? 113.2069
Mathematics
Answer the question.Which type of graphs can be difficult to interpret because of visual distortion on a flat page?
A. Contour map B. Stack plot C. Three dimensional graph D. Multiple bar graph
Mathematics
Simplify.
A. 
B. 
C. 
D. 
Mathematics
Subtract.
A. 14.1 B. 13.5 C. 12.9 D. 4.3
Mathematics