A time-series graph displays the price of gold. The slope of the line is negative for periods when the
A) price of gold is low and not changing.
B) price of gold is rising.
C) quantity of gold is falling.
D) price of gold fluctuates.
E) price of gold is falling.
E
You might also like to view...
Why is economic growth so slow or non-existent in many third world countries? What policies would you propose to improve the situation?
What will be an ideal response?
A bottle of wine costs $8 and a quiche costs $5 . At Robert's present levels of consumption, he spends all his income and receives marginal utility of $10 from the last bottle of wine and marginal utility of $4 from the last quiche. To maximize his total utility, Robert should
a. buy less wine and more quiche. b. buy more wine and less quiche. c. spend all of his money on wine. d. change his spending pattern until he buys 8/5ths as much wine as quiche.
Consider the monopoly in the figure below with price regulated at $20 per unit. The regulated price will result in a: 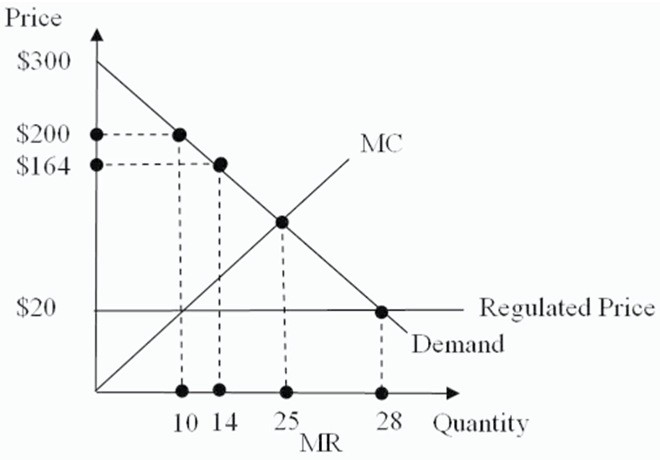
A. surplus of 18 units. B. shortage of 18 units. C. shortage of 3 units. D. surplus of 3 units.
________ shows that if all resources are fully and efficiently utilized, more of one good can be produced only by producing less of another good
A) Comparative advantage B) Absolute advantage C) The mixed market system D) The production possibilities frontier model