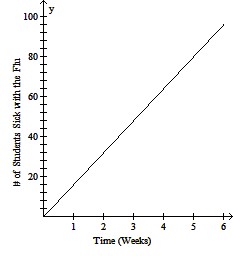
For the given graph: a) In words, describe the function shown on the graph. b) Find the slope of the graph and express it as a rate of change (be sure to include units). c) Briefly discuss the conditions under which a linear function is a realistic model for the given situation.
What will be an ideal response?
a) The number of students sick with the flu increases with time.
b) 16 students sick per day.
c) Good model if the flu rate is constant for 5 weeks.
Mathematics
You might also like to view...
Solve the problem.In an arithmetic sequence with first term P0 and common difference d, the sum of the first 200 terms is given by
A. 200(2P0 + 199d). B. 200(2P0 + 200d). C. 100(2P0 + 200d). D. 100(2P0 + 199d). E. none of these
Mathematics
Evaluate the expression for the given replacement values. Write the answer in simplest form.x ÷ y for x = -  , y =
, y = 
A. - 
B. - 
C. 
D. 
Mathematics
Find IR and R3.
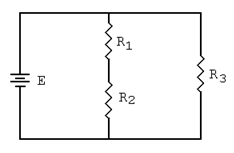
E = 24 V, R1 = 1200 ê, IR = 13 mA, and R2 = 3300 ê. Find IR and R3.
1 2
Mathematics
Find the exact value of the expression.
A. 
B. 
C. 
D. 2
Mathematics