Solve the problem.The following bar graph shows the average annual income for single mothers. i) Determine a linear function that can be used to estimate the average yearly income for single mothers from year 0 through year 5. Let t represent the year.ii) Using the function from part i, determine the average yearly income for single mothers in year 3.iii) Assuming this trend continues, determine the average yearly income for single mothers in year 13.iv) Assuming this trend continues, in which year will the average yearly income for single mothers reach $33,000?
A.
| i) | I(t) = 775.8t + 24,269 |
iii) $34,354.40
iv) year 12
B.
| i) | I(t) = 775.8t + 24,269 |
iii) $34,354.40
iv) year 12
C.
| i) | I(t) = 770.8t + 24,269 |
iii) $34,289.40
iv) year 12
D.
| i) | I(t) = 775.8t + 24,269 |
iii) $34,354.40
iv) year 13
Answer: B
You might also like to view...
Find the domain of the expression.
?
 ?
?
A. All real numbers x B. All real numbers x such that x ? -8 C. All nonnegative real numbers x such that x < -8 D. All real numbers x such that x < -8 E. All real numbers x such that x ? -8
Solve the problem.A magazine earned $87 million in 1998 from advertising revenue and subscriptions. If the advertising revenue was 8 times the subscription revenue, how much did the magazine earn from advertising?
A. $0.9 million B. $154.7 million C. $9.7 million D. $77.3 million
Use Euler circles to check the validity of the argument. ? All candy is fattening. All candy is delicious. Therefore, all fattening food is delicious. ? The argument is __________. ?
A. not valid B. valid
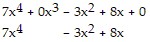
Write the polynomial in two ways: with its missing terms and by leaving space for them.7x4 - 3x2 + 8x
A. 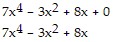
B. 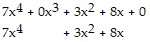
C. 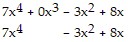
D.