According to the graph shown, if this were a perfectly competitive market, the outcome in the short run would be:
This graph shows the cost and revenue curves faced by a monopoly.
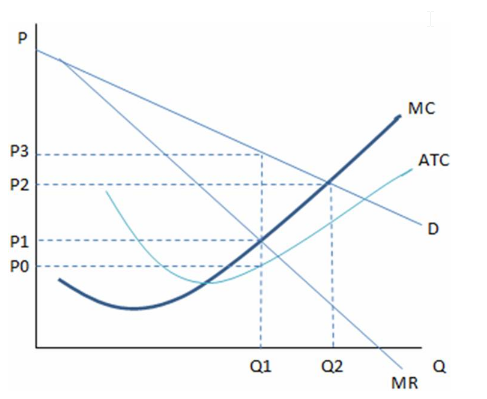
A. Q1, P1.
B. Q1, P3.
C. Q2, P2.
D. The graph is of a monopoly, and therefore there is no way to determine a perfectly competitive outcome.
C. Q2, P2.
You might also like to view...
The crowding in of private investment is associated with: a. a leftward shift of the aggregate demand curve for an economy
b. a leftward shift of the aggregate supply curve of an economy. c. a reduction in the level of government spending. d. a reduction in corporate income taxes. e. an increase in aggregate demand induced by increased government borrowing.
According to the circular-flow diagram, if Denny is the owner of a landscaping business and he just received $50 for mowing Mrs. Pendleton's lawn,
a. the $50 represents a cost of production for Denny's firm. b. the $50 represents wages, rent, and profit to Denny's firm. c. Denny acts as a firm who interacted in the markets for factors of production with Mrs. Pendleton. d. Denny acts as a firm who interacted in the markets for goods and services with Mrs. Pendleton.
A recession hits hardest in those regions that:
a. have large numbers of labor unions. b. are located near interstate highway systems and congestion. c. do not have adequate natural resources. d. produce capital goods and durable goods.
According to the Laffer curve, when the tax rate is 100 percent, tax revenue will be:
A. 0. B. at the maximum value. C. the same as it would be at a 50 percent tax rate. D. greater than it would be at a 50 percent tax rate.