Solve the problem.Suppose that during a certain step in a chemical manufacturing process the amount of chlorine dissolved in a solution, measured in parts per million (ppm), is related to the elapsed time measured from the beginning of the step. Use the following table as a representation of this relationship. Make a scatter diagram of the data. What is happening to the amount of chlorine in solution during this time frame?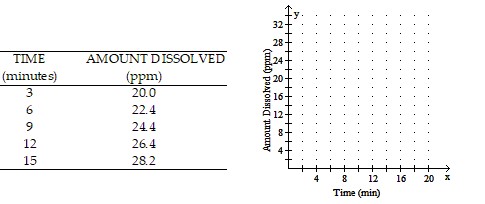
A. The amount of chlorine dissolved
increased as time elapsed.
B. The amount of chlorine dissolved
increased as time elapsed.
C. The amount of chlorine dissolved
increased as time elapsed.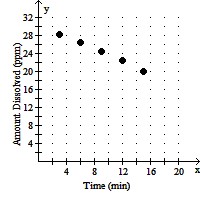
D. The amount of chlorine dissolved
decreased as time elapsed.
Answer: A
You might also like to view...
Find the reciprocal of the number.5
A. 
B. 
C. 1
D. 5
If the function is one-to-one, find its inverse. If not, write "not one-to-one."{(19, 5), (10, -1), (-19, 7)}
A. not one-to-one B. {(5, 19), (-19, 10), (7, -1)} C. {(5, 19), (-1, 10), (7, -19)} D. {(19, -1), (19, 10), (7, -19)}
Divide. Write the answer in lowest terms and as a whole or mixed number where possible. ÷
÷ 
A. 
B. 
C. 
D. 12
Use a graphing calculator to graph the equation and identify the x-intercepts. If your answers are not exact, round to the nearest tenth.y = -2.5x2 + 8.9x - 1.5
A. x-intercept: (0, -1.5)
B. x-intercepts: (0.2, 0) and (3.4, 0)
C. x-intercepts: (-3.7, 0) and (0.2, 0)
D. x-intercept: (1.8, 6.4)