Refer to the double-bar graph below which shows the number of male and female athletes at a university over a four-year period. Solve the problem.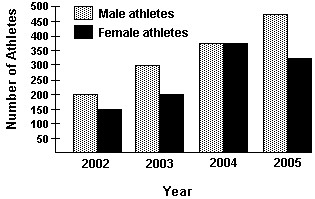 Which year had the smallest number of male athletes? What was the total number of male athletes that year?
A. 2005; 475 athletes
B. 2002; 200 athletes
C. 2003; 300 athletes
D. 2002; 150 athletes
Answer: B
You might also like to view...
Solve the problem.Find the mass of the solid in the first octant between the spheres  and
and  if the density at any point is inversely proportional to its distance from the origin.
A. 12k? B. 6k? C. 9k? D. 72k?
Add. Do not use a number line except as a check.69 + (-60)
A. 129 B. -129 C. 9 D. -9
Provide the proper response.True or False? A hyperbola has eccentricity 1.
A. True B. False
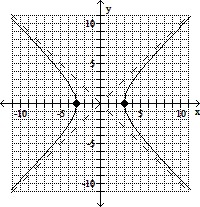
Identify and graph the conic section. Label the center and/or vertex as appropriate.7y2 - 7x2 = 63
A. circle; center (0, 0)
(-3, 0), (3, 0), (0, -3), (0, 3)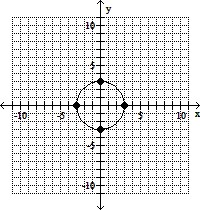
B. hyperbola; center (0, 0);
(0, -9), (0, 9)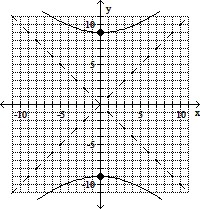
C. hyperbola; center (0, 0);
(0, -3), (0, 3)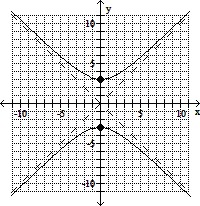
D. hyperbola; center (0, 0);
(-3, 0), (3, 0)