The table shows the aggregate demand and aggregate supply schedule for a hypothetical economy.Real Domestic Output Demanded (in Billions)Price Level (Index Value)Real Domestic Output Supplied (in Billions)$3,000350$9,0004,0003008,0005,0002507,0006,0002006,0007,0001505,0008,0001004,000Refer to the above table. Using the original data from the table, if the quantity of real domestic output demanded increased by $3000 and the quantity of real domestic output supplied increased by $1000 at each price level, the new equilibrium price level and quantity of real domestic output would be:
A. 300 and $9000.
B. 250 and $8000.
C. 200 and $7000.
D. 350 and $8000.
Answer: B
You might also like to view...
Using a discount rate above the market interest rate to evaluate projects will
a. bias a decision toward going ahead with the project b. correct for distortions in capital markets c. have no impact on project evaluation d. bias a decision toward rejecting a project e. none of the above
An essential characteristic of a perfectly competitive market is:
A. goods are standardized. B. sellers are price makers. C. buyers and sellers share market power. D. goods are unique.
When the Fed wants US interest rates to increase, it will usually sell US t-bonds to banks
a. true b. false
If we were on curve K, the upper two quintiles received about _____% of income.
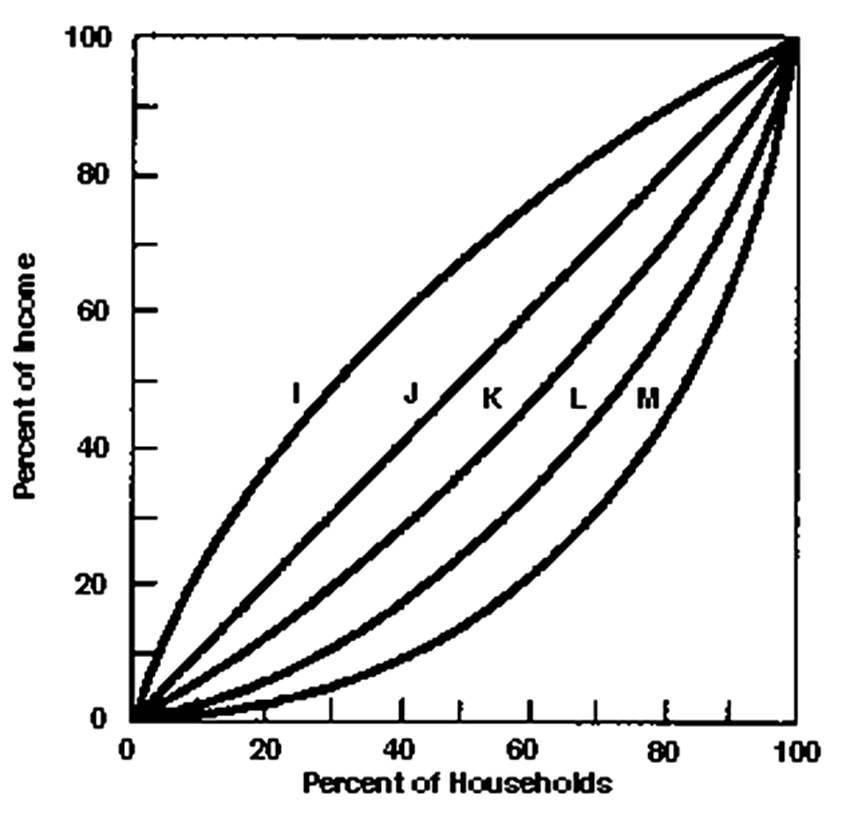
A. 25
B. 35
C. 45
D. 55