Use your graphing calculator to graph the function between  and
and  . Show the graph of
  ,
,
alt="" class="wirisformula" data-wiris-created="true" src="https://sciemce.com/media/3/ppg__cognero__Section_4.6_Graphing_Combinations_of_Functions__media__ba8705dd-f38f-410d-a342-d147bdb678f9.PNG" style="vertical-align:middle;" />, and  . (Make sure your calculator is set to radian mode.)
?

?
A. ?
?
B. ??
C. ??
D. ??
E. ?
Answer: E
Mathematics
alt="" class="wirisformula" data-wiris-created="true" src="https://sciemce.com/media/3/ppg__cognero__Section_4.6_Graphing_Combinations_of_Functions__media__ba8705dd-f38f-410d-a342-d147bdb678f9.PNG" style="vertical-align:middle;" />, and . (Make sure your calculator is set to radian mode.)
?
?
A. ?
?
B. ?
?
C. ?
?
D. ?
?
E. ?
Answer: E
You might also like to view...
Use polar coordinates to find the limit of the function as (x, y) approaches (0, 0).f(x, y) = 
A. ? B. 0 C. 1 D. No limit
Determine the prime power representation of the number.20
A. 22 ? 5 B. 52 C. 4 ? 5 D. 4 ? 2
In the circuit below, R1 = 3.3 Kê, R2 = 5.6 Kê, R3 = 4.7 Kê, and C = 846 pF. What is IC of an equivalent Norton circuit when f = fCO?
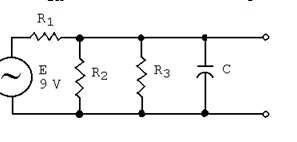
a. 4.5 mA
b. 10.7 mA
c. 1.9 mA
d. 2.7 mA
e. 1.8 mA
Simplify the expression. Assume that all variables are positive when they appear.3 +
+ 
A. 3 +
+ 
B. 4
C. 6
D. 5