Exhibit 10-7 Aggregate supply and demand curves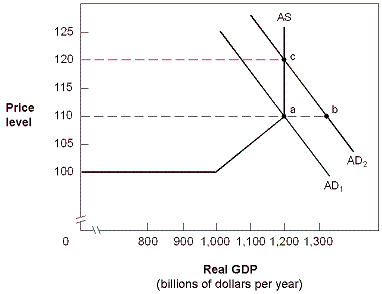
In Exhibit 10-7, the aggregate demand and supply curves reflect an economy in which:
A. full employment is at $1,000 billion GDP.
B. excess aggregate supply is created when there is a shift from AD1 to AD2.
C. excess aggregate demand forces prices up to P = 120.
D. excess aggregate demand causes prices to stabilize at P = 110.
Answer: C
You might also like to view...
Middlemen:
a. increase transaction costs. b. increase the price of goods, services and resources without providing any benefits. c. impede trade and hinder economic growth. d. reduce transaction costs.
Government regulation of working conditions is an example of government as:
A. an owner. B. an actor. C. a referee. D. a dictator.
One reason stagflation is difficult to recover from is because:
A. less output requires less inputs to be hired. B. prices tend to adjust more quickly downward than upward. C. wages are sticky downward. D. input prices increase with output prices.
?The table given below shows the output supplied by a firm and its total cost of production. If the market price is $8.50, the profit-maximizing output and profit are _____. Quantity of output. Total Cost ($) 0 50 10 85 20 150 30 220 40 305 50 455
a. ?40 units and $0, respectively b. ?40 units and $35, respectively c. ?50 units and $30, respectively d. ?0 units and ?$50, respectively e. ?30 units and $25, respectively