The bar graph shows the percentage of adults that use the Internet for specific tasks. Use the graph to represent the given set using the roster method.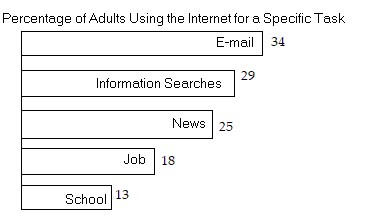 {x | x is a task in which usage lies between 15% and 33%}
A. {news}
B. {email, information searches, news, job, school}
C. {news, job}
D. {information searches, news, job}
Answer: D
You might also like to view...
Solve.In Satoru's hometown, the highest temperature ever recorded is 107°F. Convert this temperature to Celsius. Round to the nearest tenth of a degree.
A. 224.6° C B. 41.7° C C. 27.4° C D. 77.2° C
Find the sum of the squares of the deviations from the mean for the given data. 4, 5, 6, 7, 8
A. 2 B. 4 C. 10.5 D. 10
Solve the problem.If an object is propelled upward from a height of 64 feet at an initial velocity of 64 feet per second, then its height after t seconds is given by the equation  where h is in feet. After how many seconds will the object reach a height of 128 feet?
A. 1 sec B. 4 sec C. 2 sec D. 8 sec
Solve the problem.The outdoor temperature rises to  Fahrenheit. What is this temperature in Celsius?
A. 25° B. -7° C. 13.9° D. -3.9°