Refer to Figure f. A benefit function is plotted in Figure f. The letter B represents the:
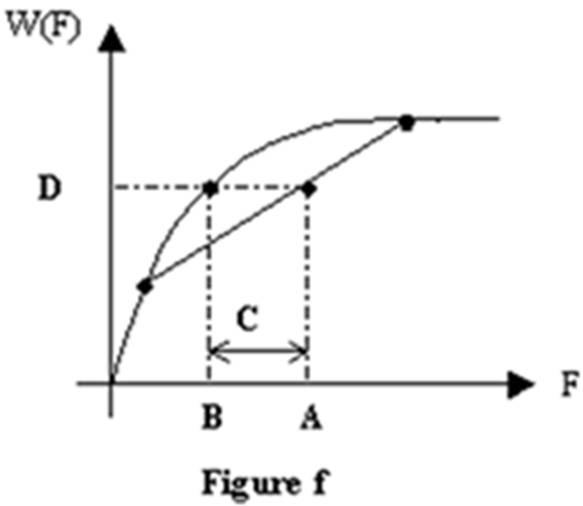
A. risk premium of the consumption bundle.
B. expected utility of the consumption bundle.
C. certainty equivalent of the consumption bundle.
D. expected consumption.
C. certainty equivalent of the consumption bundle.
You might also like to view...
Richard runs a pizza delivery restaurant. List the three basic types of decisions studied in economics and give an example from Richard's restaurant
What will be an ideal response?
In the period 1960–95, the cycles of upturns and downturns in the economy (booms and recessions)
(a) were eliminated as knowledge of how the economy operated grew. (b) continued to occur, although not nearly as severely as prior to World War II. (c) grew even worse than prior to World War II. (d) were equally as bad as the period prior to World War II.
According to data on GDP growth between 1980 and 2009, which of the following statements is true?
What will be an ideal response?
How is accountability achieved for the Federal Reserve and is it clear?
What will be an ideal response?