Refer to Scenario 1 . Assume this economy could either be at Point B or Point C. From which of these points is it more costly to produce more crabs? Explain your answer
What will be an ideal response?
It's more costly to produce more crabs from Point C than it is to produce more crabs from Point B. The reason is that as you move up the production possibilities frontier the more crabs you produce the greater the amount of fish the economy will have to give up to produce them. For example from Point B the opportunity cost of producing 15 more crabs is twenty fish. However, if we start from Point C and wish to produce 15 more crabs we have to give up 30 fish.
You might also like to view...
On the graph above, suppose the economy has moved from point H to point G. If the shock was temporary and inflation expectations are adaptive, the economy will next ________
A) return to point H B) move to point F C) move to a point between points G and H D) remain at point G E) none of the above
In the spring of 2002, the Japanese Ministry of Finance intervened in the foreign exchange market by selling yen and purchasing dollars. Why? And why did the intervention fail?
What will be an ideal response?
Table 1.2 shows the hypothetical trade-off between different combinations of Stealth bombers and B-1 bombers that might be produced in a year with the limited U.S. capacity, ceteris paribus.Table 1.2Production Possibilities for BombersCombinationNumber of B-1 BombersOpportunity cost(Foregone Stealth)Number of Stealth BombersOpportunity cost (Foregone B-1)A20NA195 B35 180 C45 150 D50 100NAOn the basis of Table 1.2, what is gained by producing at point B rather than point A?
A. 15 Stealth bombers. B. 15 B-1 bombers. C. 195 Stealth bombers. D. 35 B-1 bombers.
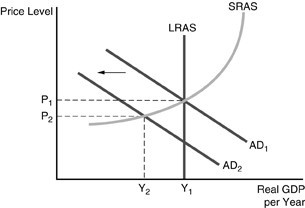 Refer to the above figure. Unexpected contractionary monetary policy has caused the aggregate demand curve to shift to AD2. In the short run
A. real GDP will be Y2, and the price level will be P2. B. real GDP will be between Y1 and Y2, and the price level will be below P2. C. real GDP will be Y1, and the price level will be P1. D. real GDP will be between Y1 and Y2, and the price level will be above P1.