In the table above, the number of unemployed people is
A) 2,000. B) 3,000. C) 1,000. D) 1,100. E) 11,000.
C
You might also like to view...
You have data for sales of pizza for each of the 50 states in 2011. The type of graph to best display these data would be a
A) trend-line diagram. B) scatter diagram. C) multi-variable time-series graph. D) cross-section graph. E) time-series graph.
The region of the U.S. that benefited least from and fought hardest against raising tariffs in the first half of the nineteenth century was
(a) New England. (b) the Middle Atlantic states. (c) the South. (d) the West.
control of the nation's quantity of money is handled by
What will be an ideal response?
Refer to the data. In determining real GDP, the nominal GDP for:
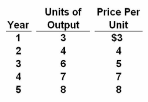
Assume an economy that makes only one product and that year 3 is the base year. Output and price data for a five-year period are as follows. Answer the question on the basis of these data.
A. each year must be multiplied by the relevant price index.
B. years 1 and 2 must be inflated.
C. years 4 and 5 must be inflated.
D. years 1 and 2 must be deflated.