Construct a broken-line graph of the data in the table.The following table gives the total amount of precipitation during the given months. Use time on the horizontal scale for your line graph.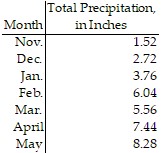
What will be an ideal response?
Answers may vary. A possible answer follows.
Mathematics
You might also like to view...
The following table shows the cost R, in dollars, of renting a car for t days.
 1 2 3 4
 $131 $235 $339 $443?
Which formula below fits these data?
?
$131 $235 $339 $443?
Which formula below fits these data?
?
A. 
B. 
C. 
D. None of the above
Mathematics
Add the given pair of complex numbers geometrically.z1 = 5i, z2 = 6
A. 11i B. 6 - 5i C. 5 + 6i D. 6 + 5i
Mathematics
Determine whether the number is divisible by 2, 3, 4, 5, 6, 8, 9, and/or 10.3763
A. 5 B. 3, 5 C. 3 D. None
Mathematics
Evaluate the expression for the given replacement values. Write the answer in simplest form.x + y for x = -  , y =
, y = 
A. 
B. 
C. - 
D. 
Mathematics