Assume the graph shown represents the market for pizzas sold in an hour. If the original equilibrium was D and S1. Which of the following is true when S1 shifted to S2?
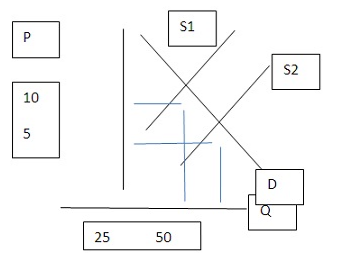
A. Equilibrium price decreased by $5.
B. Equilibrium quantity increased by 20.
C. Equilibrium price increased by $5.
D. Equilibrium quantity increased by 30.
A. Equilibrium price decreased by $5.
You might also like to view...
________ policy focuses on the nation's money supply, while ________ policy aims at changing the underlying structures or institutions of the economy.
A. Monetary, fiscal B. Monetary; structural C. Fiscal, structural D. Fiscal, monetary
During menstruation, the bleeding is the result of:
A. a ruptured fallopian tube. B. a ruptured follicle. C. detachment of the myometrium. D. deterioration of the endometrium.
A zero-sum economy would result from
A. moderate economic growth. B. excessive growth after adjusting for inflation rates. C. a lack of economic growth. D. nominal GDP growth.
ERISA was passed to make sure which of the following was adequately funded?
A. Defined contribution programs B. Social Security C. Defined benefit pension programs D. Ponzi schemes