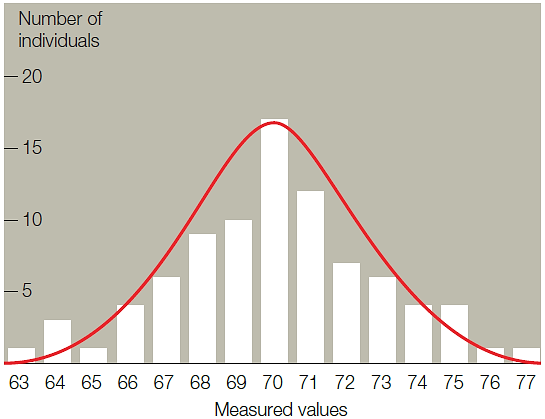
Figure 13.15
A graph of phenotypic variation similar to the accompanying illustration strongly suggests
A. incomplete dominance.
B. codominance.
C. epistasis.
D. polygenic inheritance.
E. environmental effects on phenotype.
Answer: D
You might also like to view...
Arrange the steps in translation in order from earliest to latest
A) movement of the ribosome three bases closer to the 3' end of the mRNA B) peptide bond formation C) identification of initiator codon and joining of large and small ribosomal subunits D) release of the polypeptide from the ribosome and dissociation of ribosomal subunits E) binding of a charged tRNA to a codon in the A site of ribosome
Of the following list, which two factors are the main sources of differences among humans? 1. genetic variation 2. behavioral differences 3. differences in metabolism 4. environmental differences
A. 1 & 2 B. 1 & 4 C. 2 & 4 D. 3 & 1
Which of the following populations would have the highest population growth rate?
A. a population with a high natality and a high mortality B. a population with very few old animals in it and a large number of young animals C. a population in which 65% of the animals are males D. a population with low natality and high mortality
If the sequence of bases in mRNA is U, C, A, the sequence of bases in DNA is
A. A, G, and U. B. A, G, and T. C. A, C, and A. D. T, G, and U.