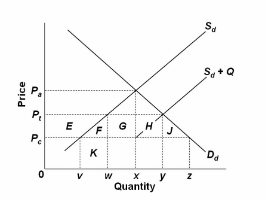
Refer to the diagram, where S d and D d are the domestic supply and demand for a product and P c is the world price of that product. S d + Q is the product supply curve after an import quota is imposed. A tariff of P c P t will:
A. lower domestic price and increase domestic consumption.
B. increase the revenues of domestic producers by areas E + F + K.
C. increase the revenues of domestic producers by areas G + H.
D. increase the revenues of domestic producers by areas E + F + G + H + J.
B. increase the revenues of domestic producers by areas E + F + K.
You might also like to view...
Using the data in the above table, when output increases from 4 to 9 units, the marginal cost of one of those 5 units is
A) $4.00. B) $4.25. C) $5.00. D) $6.25.
Refer to Figure 4-5. What is the area that represents consumer surplus after the imposition of the ceiling?
A) A + B + D + F B) A + B + C C) A + B + D + F + G D) A + B+ D
The natural rate of unemployment is also called:
A) non-accelerating inflation rate of unemployment. B) accelerating inflation rate of unemployment. C) accelerating deflation rate of unemployment. D) none of the above.
When the dollar strengthens,
A) exports will increase and U.S. consumers benefit. B) imports will increase and U.S. consumers benefit. C) exports will decrease and U.S. exporters benefit. D) exports will increase and U.S. exporters gain.