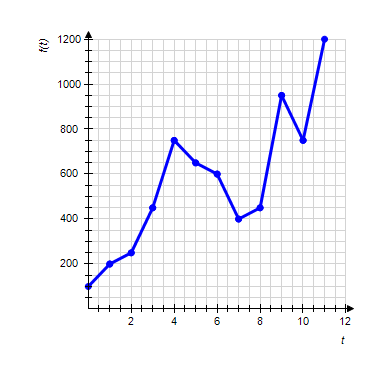
Graph shows the number of sports utility vehicles  sold in the United States. represents sales in year t in thousands of vehicles. Use the graph to estimate the largest value of
 ![]()
src="https://sciemce.com/media/2/ppg__cognero__1.2_Functions_and_Models__media__1145267d-d9ec-43be-86f3-a985b9369575.PNG" style="font-size:14.6667px;vertical-align:middle;" /> for  .
.
?
?
A. 950,000
B. 650,000
C. 1,200,000
D. 750,000
E. 600,000
Answer: D
You might also like to view...
Solve the problem.In how many ways can 6 people line up for play tickets?
A. 720 B. 6 C. 1 D. 46,656
Solve the given applied problems involving variation.The weight of a body above the surface of the earth is inversely proportional to the square of its distance from the center of the earth. What is the effect on the weight when the distance is multiplied by 2?
A. The weight is multiplied by 2. B. The weight is multiplied by 4. C. The weight is divided by 4. D. The weight is divided by 2.
Solve the equation.log2(x + 4) = 1 + log2(x + 1)
A. 
B. 
C. 
D. 
Find the slope of the line using the concept of rise over run.
A. -1 B. Undefined C. 1 D. 0