Figure 8-2

Figure 8-2 shows a manufacturer’s total profit curve. To maximize total profit, the manufacturer should produce ____ units of output.
A. 10
B. 12
C. 16
D. 18
Answer: B
You might also like to view...
High concentration measures will understate the extent of competition in a market if
A) the true geographical scope of the market is global rather than national. B) entry into the industry is easy. C) the geographical scope of the market is regional rather than national. D) Both answers A and B are correct.
Which of the following will cause a leftward shift in the aggregate demand curve?
A. a reduction in government spending B. an increase in taxes C. a reduction in the money supply D. all of these
Which of the following is an example of outsourcing?
A) A U.S. firm moves a manufacturing plant from the U.S. to Thailand where the firm can hire cheaper labor. B) A German firm hires an accountant in the U.S. to manage its payrolls. C) All the above are examples of outsourcing. D) None of the above is an example of outsourcing.
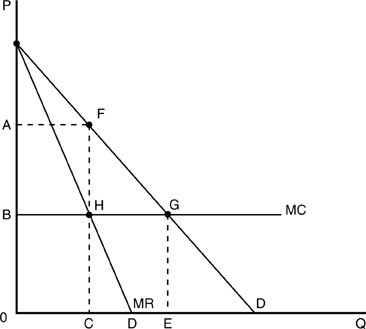 In the above figure, the difference between the competitive industry price and that of the monopolist is
A. CE. B. 0B. C. 0A. D. AB.