Draw a graph showing the long-run average cost curve for a firm that experiences economies of scale.
What will be an ideal response?
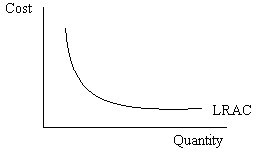
As shown in the graph, the long-run average cost curve for a firm that experiences economies of scale is "L" shaped.
You might also like to view...
In the above figure, the competitive unregulated equilibrium is producing and consuming ________ vaccinations per year at a price of ________
A) 30 thousand; $40 B) 30 thousand; $30 C) 30 thousand; $20 D) 50 thousand; $30
The text describes three different "degrees" of price discrimination
Of these, which one is theoretically capable of generating the greatest amount of economic profit for the firm? Why? In contrast, which one do you think has the greatest applicability to the range of goods and services consumers typically purchase?
Over time, technology tends to:
A. diminish in nations that are still developing. B. spread from country to country, equalizing opportunity costs. C. allow developing nations to experience the "catch-up" effect. D. set countries apart in terms of productivity.
Briefly explain the factors that shape the supply for loanable funds curve.
What will be an ideal response?